Making a Wireless Temperature Logger
It’s hot in Stockholm right now — around 30°C at the time of writing 🥵. That’s too hot for me and more importantly, too hot for our labs at SU. Perhaps I’m being slightly dramatic — the lab in question is air-conditioned to some extent but I wanted a way to keep an eye on the situation over the summer and also have an excuse to start a new project!
Sensor Requirements
- Wireless and capable of connecting to the eduroam network for remote access.
- Accurate temperature readings (±0.5°C).
- Reasonably cheap.
After a bit of digging I came across the ESP32. It’s an all-in-one microcontroller capable that has built-in Wifi, Bluetooth, and loads of interfaces to connect sensors. It really is complete overkill for this project but that’s not neccessarily a bad thing! I don’t have enough knowledge to design a decent circuit board from scratch here so some kind of ready made development board would be ideal. I looked for a nice development board containing the the micro and settled on the Huzzah32 from Adafruit.
To measure the room temperature, there are plenty of sensors to choose from but best not to reinvent the wheel. The DS18B20 is popular amoung hobbyists and has plenty of pre-written packages that I can incorporate into my code later. It also has the benefit of having a wide temperature range (-55°C to +125°C) and 0.5°C Accuracy from -10°C to +85°C.
- Huzzah32 [229 SEK]
- DS18B20 [99 SEK]
- Prototyping Board [59 SEK]
- 4.7 k resistor [< 1 SEK]
Database
I’m no expert here either but a cursory search led me to InfluxDB which is a “time series database designed to handle high write and query loads”. Perfect even though it’s unlikely this thing will see more than 1 query per second! In addition, it can be queried using an SQL-like language.
One of the main benefits to me is the ability to add an unlimited amount of new sensors automatically. As long as each sensor has a unique ID, the data can be sent to InfluxDB and it will accept it, timestamp it, and store it. Once the system is up and running, ideally I’ll never have to touch the database again.
Where should the database live? I’ve already got a a virtual server setup (it runs this blog amongst other things) which I can use to host the database. I’ll give it a domain too (jonathanrd.com) which makes it easily accessable from any location. Sensors wont have to be on the same local network.
Putting it together
If you take a look at the DS18B20 datasheet you’ll see that the data wire requires a 4.7 kΩ pull-up resistor. I bought a pack of 100 resistors as they’re so cheap but, by mistake, I chose tiny surface-mount components instead of larger easy-to-solder parts.
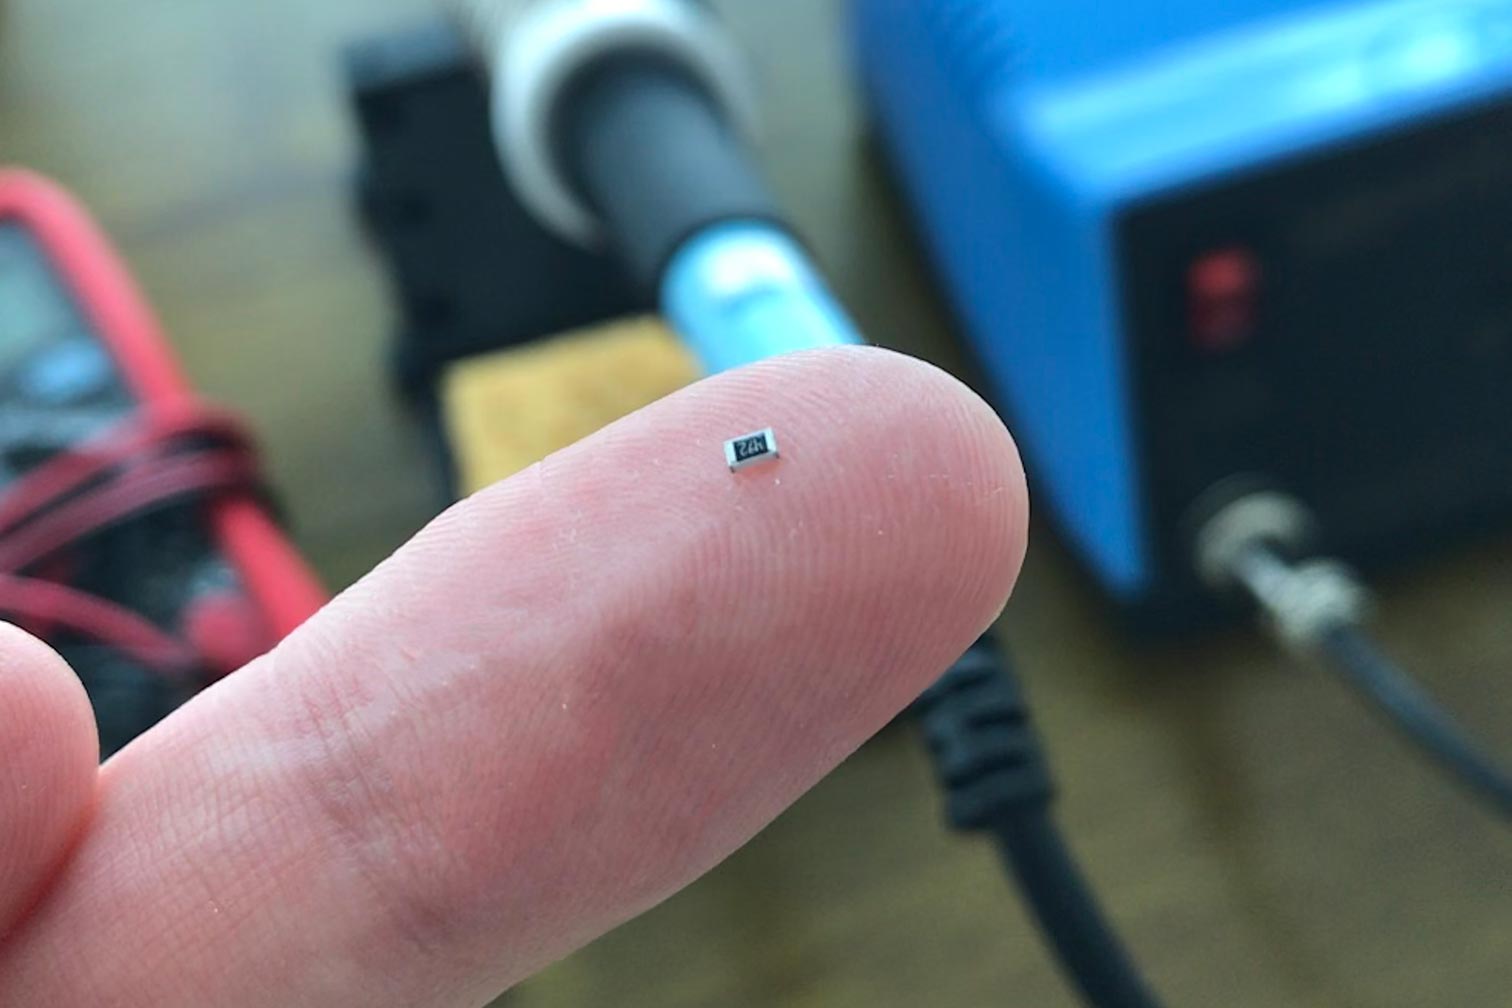
A 4.7 kΩ resistor. Why did I buy surface-mount components?! 🤦♂️
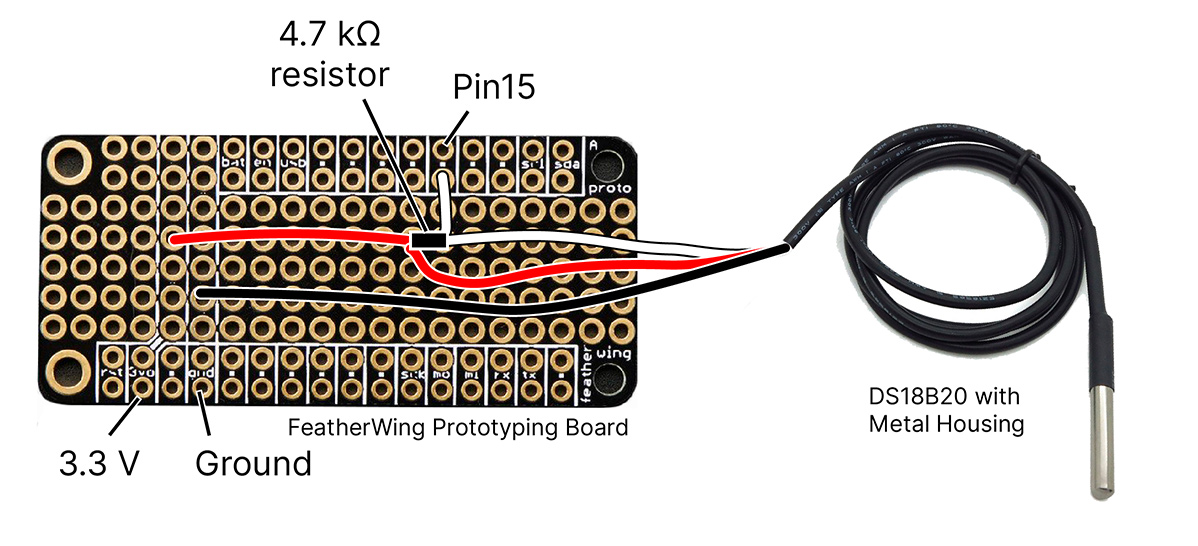
Connecting the sensor is fairly simple, I used some prototyping board which matches the Huzzah32 footprint from Adafruit. Soldered on the resistor and then the DS18B20’s wires. Then linked the protoboard to the Huzzah32 with the provided header pins. If you want more than one temperature sensor then you can add them all onto one bus (i.e. tie the data pins together) and read each in turn in software.
Getting the code to work
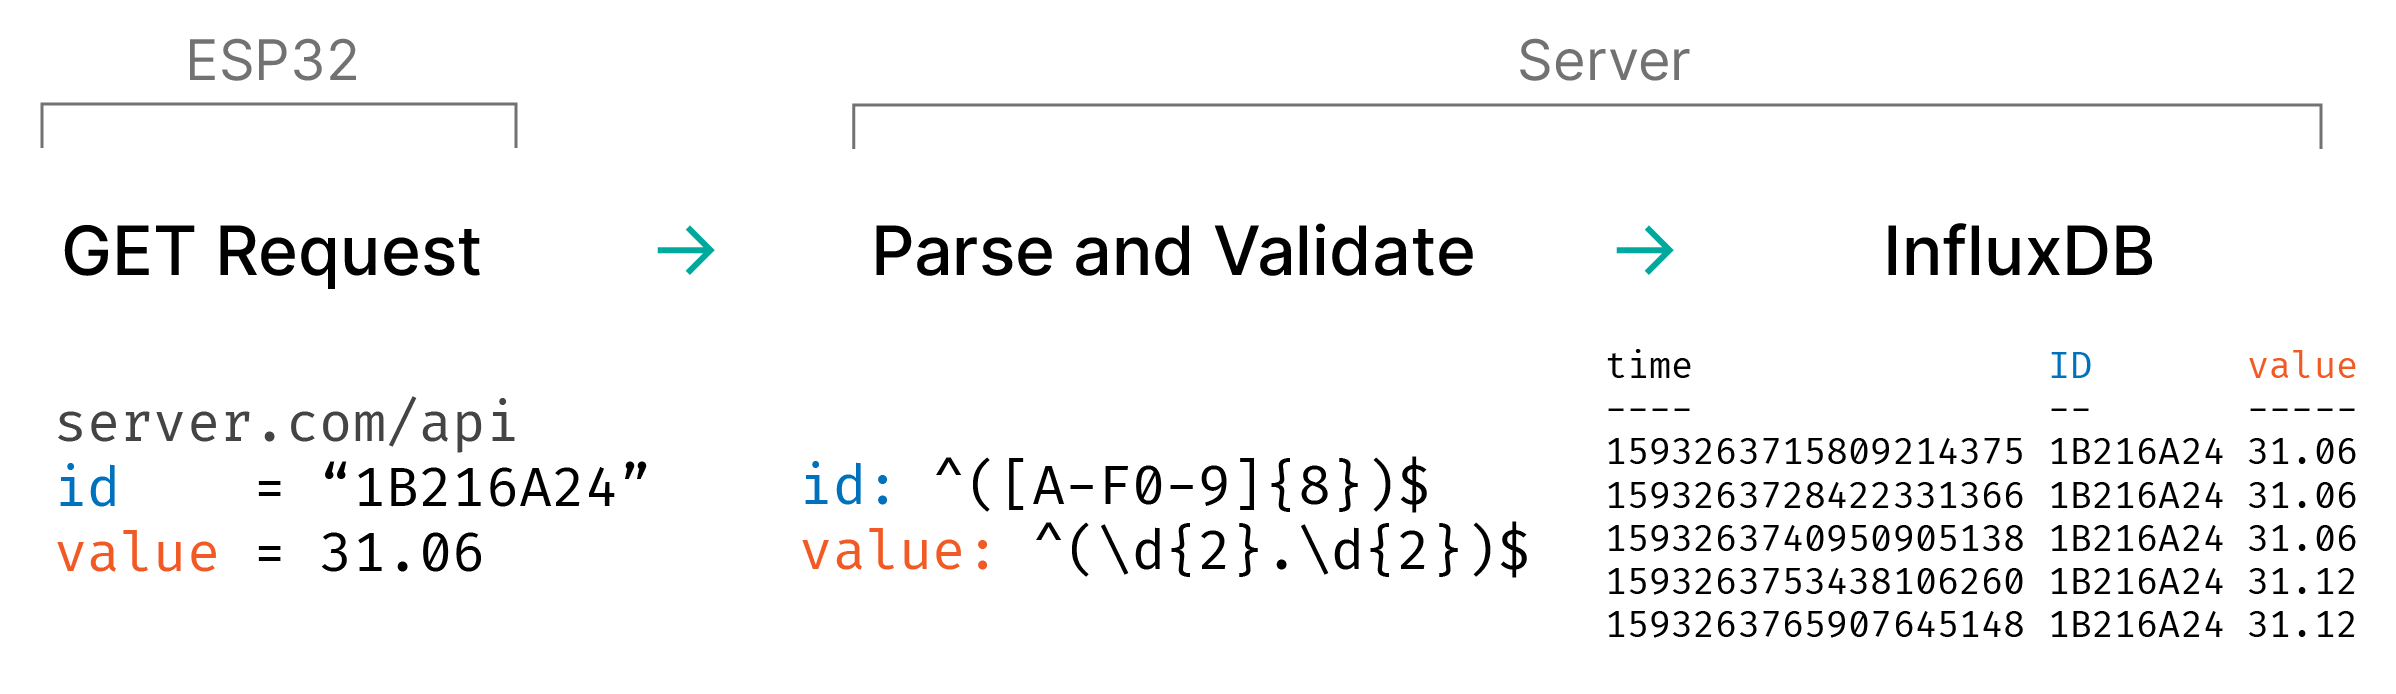
There are many ways to get the data from the ESP32 into our database. The most obvious is sending each reading directly to the database but I decided to add a layer of security in the middle. In my setup, the database is only accessable from within the server. For this method to work, the ESP32 must first send the data to a validator on the server which then forwards it to the local database.
The validator can use simple regular expressions to ensure the incoming data looks like what we expect it to look like. An overview of the data flow is shown below.
To program the ESP32 within the Huzzah32 dev board, I used the Arduino IDE. The ESP32 code that I used is a bit of a mess, combining snippets of other examples and scripts found online. Put simply, it connects to the Wifi, reads the DS18B20 temperature, and sends that data to my server via a GET request. I’m not going to go into detail (perhaps another time), if you wish you can download the code here.
For the validation part, I wrote a simple PHP script which runs on the server:
<?php

// Read the values from the GET request
$id     = $_GET["id"];
$value  = $_GET["value"];

// Validate the ID
if (preg_match('/^([A-F0-9]{8})$/', $id) == FALSE){
  die();
}

// Validate the temperature
if (preg_match('/^(\d{2}.\d{2})$/', $value) == FALSE){
  die();
}


// Prepare the InfluxDB data
$influxdb = 'http://127.0.0.1:8086/write?db=sensor';
$influxdata = "SENSOR,ID=$id value=$value";

// Use cURL to POST the data into InfluxDB
$cURLConnection = curl_init($influxdb);
curl_setopt($cURLConnection, CURLOPT_POSTFIELDS, $influxdata);
curl_exec($cURLConnection);
curl_close($cURLConnection);

?>
It reads the data fed from the ESP32, then ensures it matches some regular expressions and forwards the data to the InfluxDB using curl. For the purpose of this post I’ve kept things as simple as possible, but there really should be some method of authentication between the ESP and the validator.
To setup InfluxDB, I followed the setup instructions here. Then I created the database that holds the sensor readings by running the command “influx”, then entering CREATE DATABASE sensor. The firewall rules on my server ensure that InfluxDB is only locally accessible.
Final result
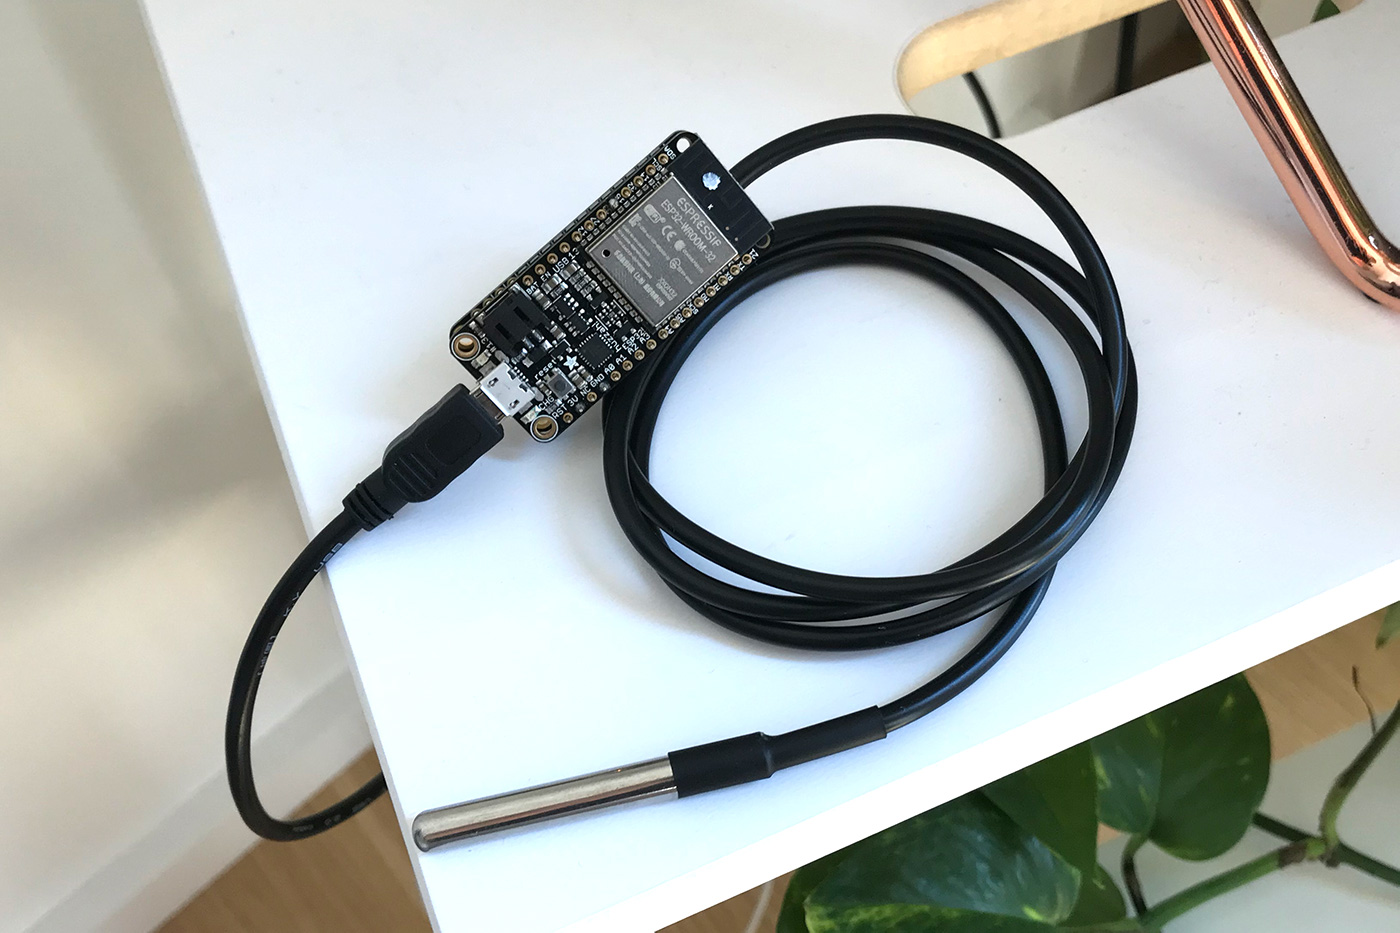
The finished device - Huzzah32 dev board with DS18B20 sensor attached.
At this point everything is working. The ESP sends the data to the validator script which in turn sends it to InfluxDB. One problem: how do we visualise the data. Of course, we can just query InfliuxDB and see a list of measurements, which is helpful if you only care about the current temperature. But even better would be the ability to see a graph containing all the data.
For this I turned to Grafana, a self-hosted graphing service which can be easily connected to InfluxDB and run as a webservice.
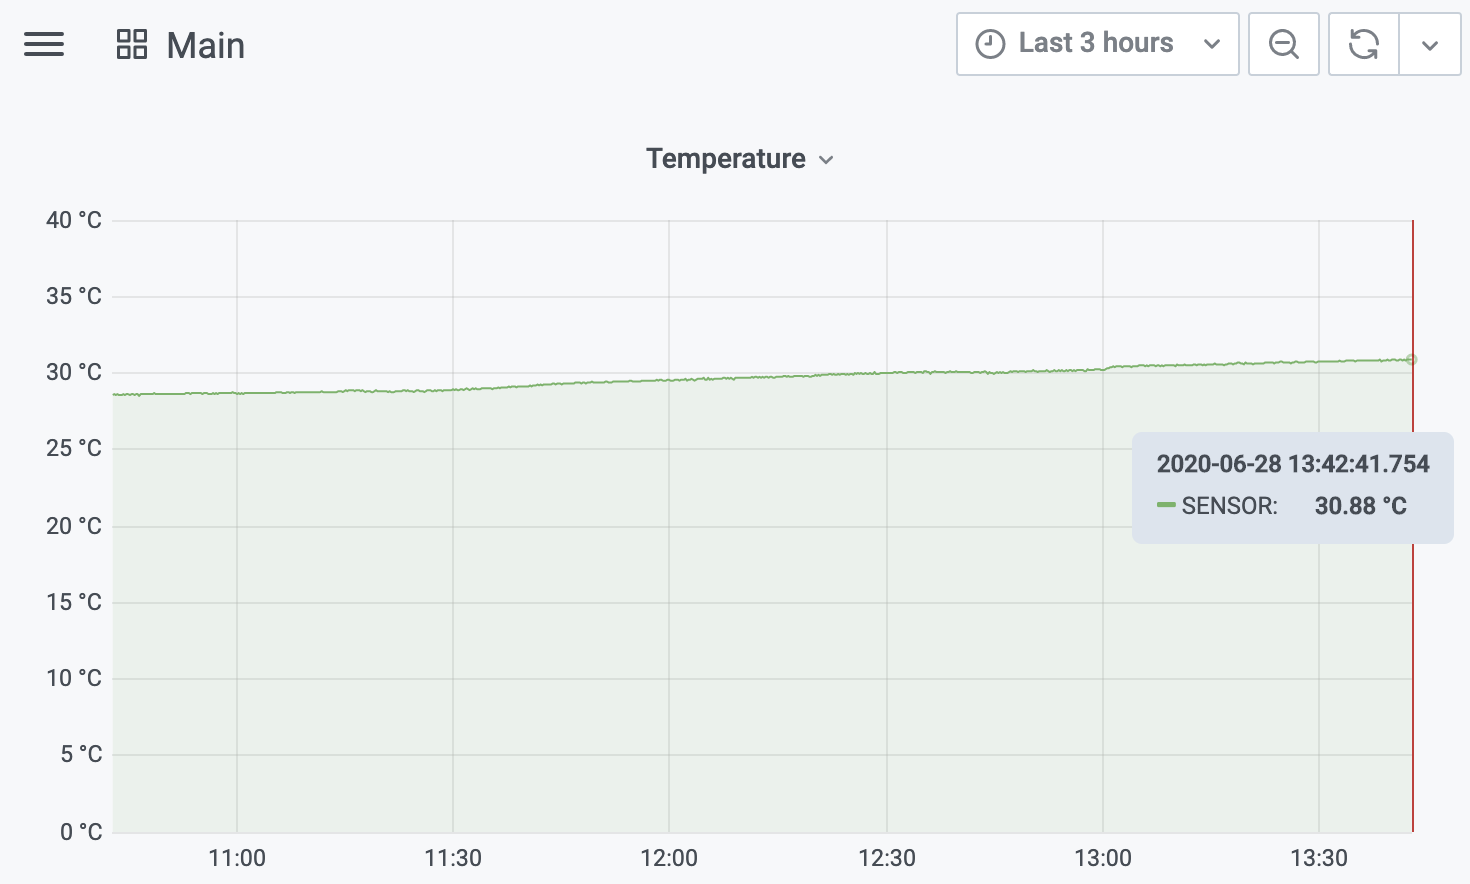
The view from Grafana showing the temperature during testing in my apartment… I told you it’s hot!
And we’re done! All that’s left is to take it to the lab. Future me should probably tidy a lot of this up. For now though, it does what I want it to do!